One can invest some money in a particular mix and just leave it alone for 16 years. However, the outcome will really depend on the movement of the markets and the asset classes that do relatively well will automatically have a higher allocation in it.
Here is a table of the beginning and end asset mixes to show you what happens to your portfolio of HK Equity and HK Fixed Income:

What we have done in previous articles is to rebalance each month back to the original allocations. This means that if we started off with a 50% equity + 50% fixed income mix, we would end up with the same mix at the end.
I would remind you assuming no transaction costs is not realistic, but we are doing this to understand what happens by rebalancing.
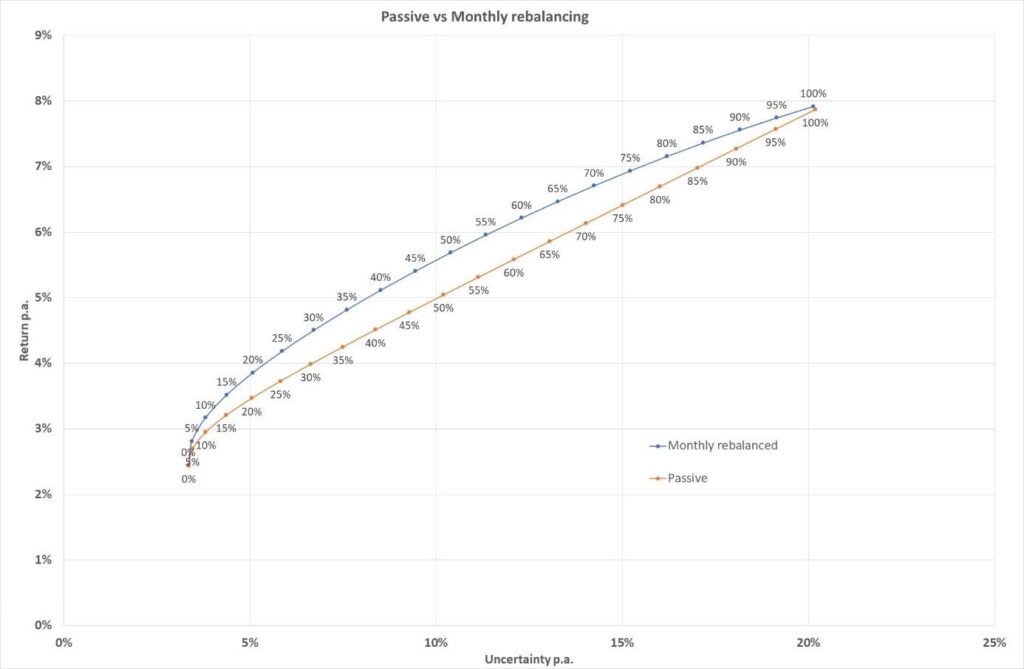
So as in the previous article, we will chart the return per annum and the uncertainty per annum for each asset allocation either (i) with a passive holding and (ii) with monthly rebalancing and this is shown below.
As you can see, the blue line (monthly rebalanced) is higher than the orange line (passive). What this means is that over the long term, you can get a higher return for the same level of uncertainty by rebalancing in a disciplined way, at least before transaction costs.
Why is this so? Well – if for example, equity falls relative to fixed income – then the monthly rebalancing forces you to buy a relatively undervalued asset class (equity) and sell a relatively overvalued asset class (fixed income).
Conversely, if equity increases relative to fixed income, then the monthly rebalancing rule requires you to buy a relatively undervalued asset class (fixed income) and sell a relatively overvalued asset class (equity).
So, a disciplined, monthly rebalancing imposes a “value” rule on your investments i.e., to (at the margin) buy an asset that has fallen in value and to sell an asset that has increased in value.
I emphasize that monthly rebalancing is not guaranteed to give you a better outcome, particularly after transaction costs – it is that over the last 16 years (which is relatively long), it has done so and this just illustrates the benefit of having a disciplined investment plan.
Let us now see what happens if we do the opposite i.e., we now increase our allocation assets that have gone up last month instead. For the purposes of this exercise, if (say) equity does better than fixed income last month then we increase the allocation to equity by 1%. If equity does relatively worse than fixed income, then we decrease the allocation to equity by 1%. This is sometimes known as a momentum type of rule i.e., you are following the trend of the market and increasing your exposure to the market that is going up..
Here is a table of the beginning and end asset mixes to show you what happens to your portfolio of HK Equity and HK Fixed Income after 16 years:
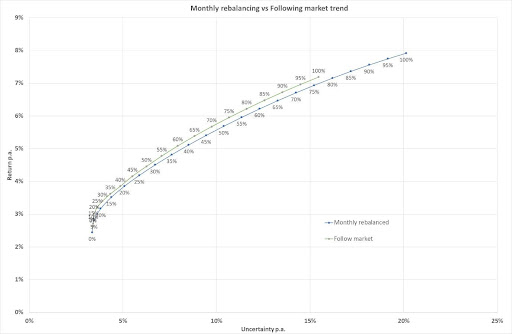
Comparing this method to the monthly rebalanced one:
What does this mean – well it means that in an equity market that is trending up, you would keep increasing your allocation to the market (although quite slowly in this example). In an equity market that is trending down, you would keep decreasing your allocation to the market. In a market that goes up and down a lot, you would be buying/selling a lot (and transaction costs which have been ignored, will impact on the results).
The outcome of this rule is to overall reduce returns (as you can see by comparing the green line points against the blue line points). However, the uncertainty is also reduced, and this might be something that you may have an interest to do i.e., give up some return for reduced uncertainty.
This article is not advocating one particular way of rule-based asset allocation rule over another. It is just to show you how different rules can impact the outcome.
I again point out that transaction costs have not been factored into these numbers, which would reduce the outcomes. The rules are also dependent on what actually happened in the last 16 years– if the markets had behaved differently, the comparisons could have been different.
Next article, we will try changing time frames and look at the impact of longer investment periods.
© 2025 Bowtie Life Insurance Company Limited. All rights reserved.


